Products
Software
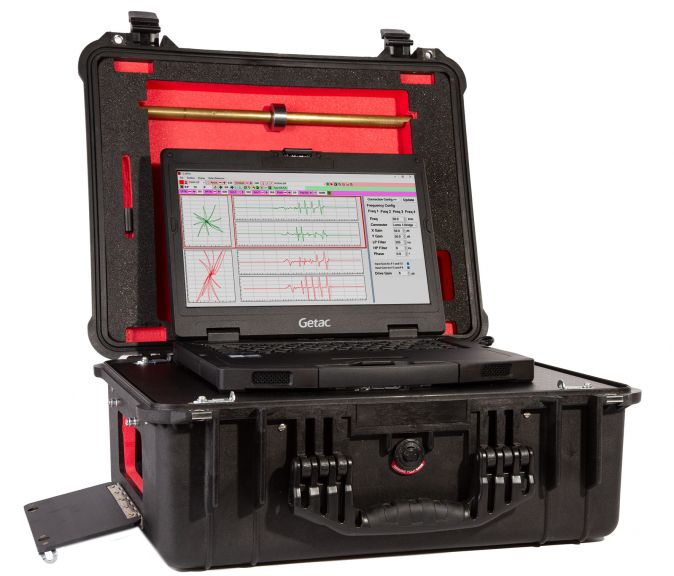
EtherMap is the main user interface for the headless advanced EC flaw detector, the ETi-300, developed for tube inspection. Additionally EtherMap can be used for data analysis alongside the AeroCheck range and SteelCheck.
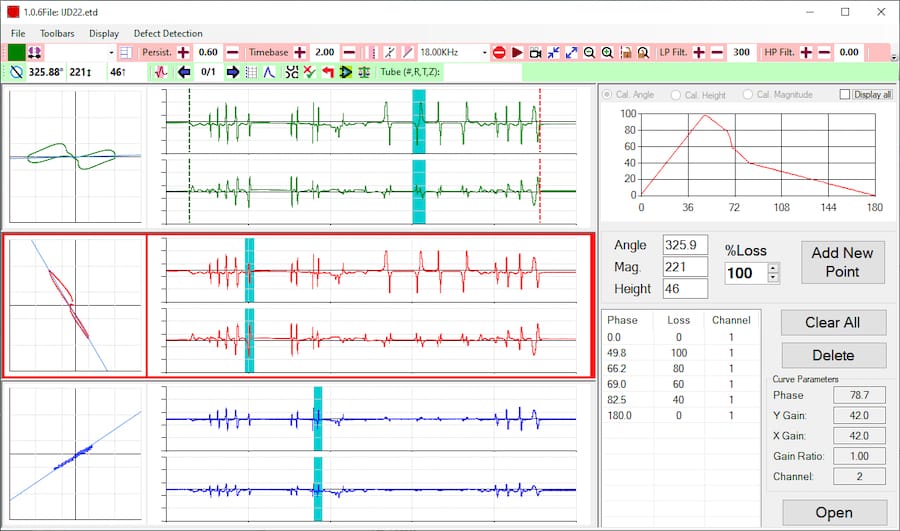
This versatile software has been developed to interface with our latest eddy current instruments where it can control and receive live inspection data in the field, or work with previously recorded data. EtherMap is intuitive and capable of processing and analysing data on its own or as an integral part of our end-to-end offering with TMR ET*, when being used as part of the holistic tube inspection solution under the ETi-300.
*TMR ET Software under Licence from Talcyon Pte
Main Analysis

Cal Curves
Export to Excel
Industries & Applications
Features
Main Analysis
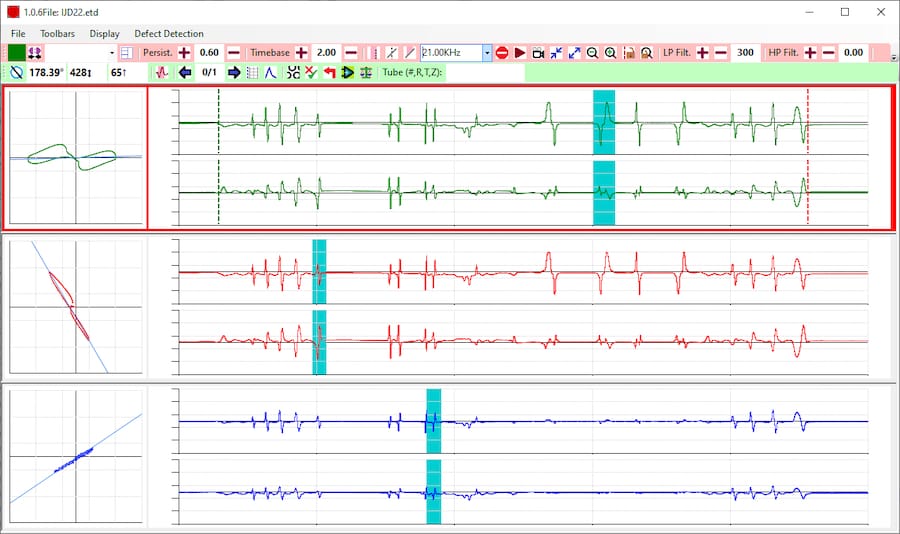
Tube inspection data is shown on a strip chart with the highlighted areas shown on the Phase Plane area (to the left of the strip chart). Parameters of a LIVE inspection can be changed via the toolbar (Frequency, Gain, Filters, Phase).

Cal Curves
The Cal Curve window is opened up on the right hand side. It allows the creation of Calibration Curves and then the analysis window will use these to estimate the size and type of a defect. These curves can be created for any of the channels of data and can be based on the parameters of Height and Magnitude as well as the usual Phase.

Easy Zoom & Angle Configuration
Shows that windows can be displayed vertically as well as horizontally and that the PhasePlane area can be made larger. A “line of best fit” is automatically added to the PhasePlane from which the Angle, Magnitude and Height are automatically calculated. These numbers are used to either manually or automatically identify defect severities from a Cal Curve.
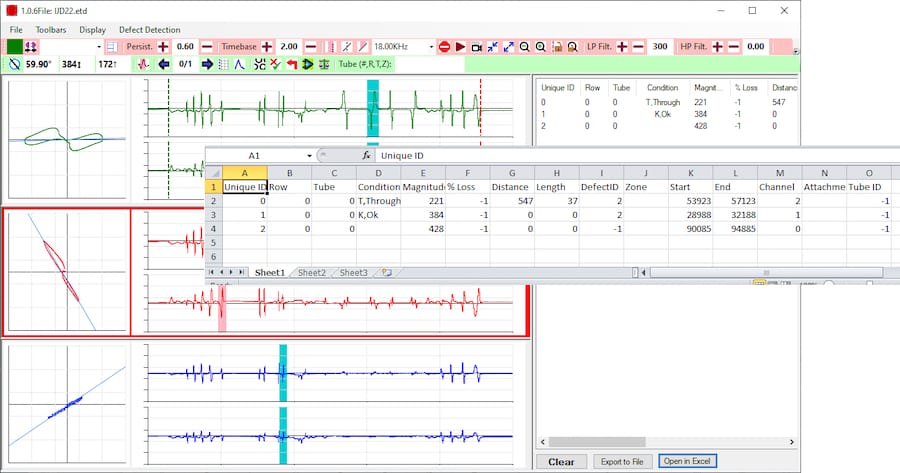
Export to Excel
If ETherMap can export all defect data to Excel to then simply be integrated in to a report.

